The quick answer
To compare solar quotes fairly, recalculate every proposal with the same household consumption, production-modeling method, self-consumption share, import and export rates, incentive treatment, financing basis, and time horizon. Then compare the remaining differences: net installed cost, equipment, scope, warranties, and production guarantees. Headline payback figures are not comparable until those assumptions are aligned.
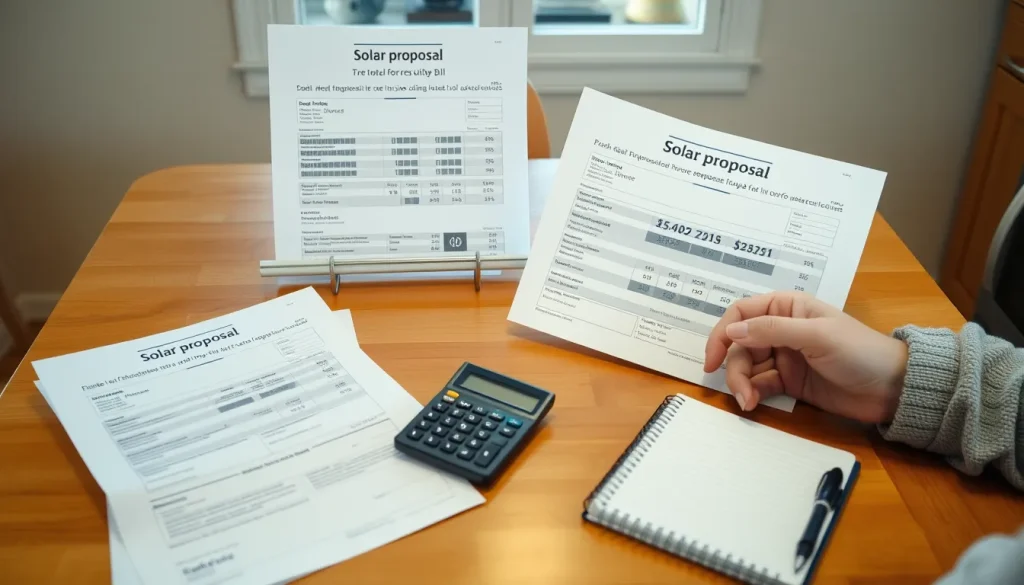
Solar quotes are not comparable just because each one has a price, an annual production estimate, and a payback figure. One proposal may assume that you use more of your solar power on-site, that utility rates rise quickly, or that you qualify for an incentive that has not been confirmed. The useful comparison is the one you create after putting every proposal on the same assumptions for household use, rates, incentives, financing, and time horizon. ENACT’s guide to comparing solar quotes notes that proposals may use different assumptions for system design, energy generation, and energy costs over a 20–25 year period, so the underlying assumptions matter as much as the headline price.
Why headline payback figures mislead
A payback estimate is an output of many inputs. Change the self-consumption share, the import rate, the export credit, or the assumed rate increase, and the payback can move sharply even when the equipment is identical. The solar.org.uk guide puts it directly: three quotes are not comparable as they arrive because each installer chose its own generation model, self-consumption assumption, and energy prices. Energy Bill HQ makes the same point for payback: recalculate both quotes with the same bill, export assumptions, incentive treatment, financing, and years-in-home horizon.
That does not mean every quote must have the same system size. A larger array can legitimately produce more electricity. It means the modeling rules should be consistent, and the remaining differences should be the ones you are actually choosing between: capacity, equipment, workmanship, warranty, scope, and price.
Step 1: Fix the household baseline
Start with 12 months of electricity use in kWh, not a single monthly dollar amount. A full year captures seasonal heating, cooling, and lighting patterns. Separate usage charges from fixed monthly fees, because solar usually does not eliminate a fixed connection or customer charge. If you are planning a major change—such as adding an electric vehicle or replacing a gas furnace—model the same future-use scenario in every quote and label it as a scenario, not current use.
Ask each installer to show the annual kWh baseline used in the proposal. If one quote uses 8,000 kWh and another uses 12,000 kWh, their savings estimates are answering different questions.
Step 2: Use a consistent production model
System capacity in kW is not the same as annual generation in kWh. Capacity describes the array’s size under standard conditions; annual generation depends on location, roof orientation, tilt, shading, module and inverter specifications, and weather. Two 8 kW systems can have different expected production on different roofs or with different equipment.
For each quote, require the annual generation estimate, the modeling method or tool, the roof areas used, shading assumptions, and whether any production guarantee applies. If the proposals use different generation estimates, ask each installer to rerun the numbers with one agreed modeling method for the same roof. Do not accept more panels means more savings without seeing the production estimate and the normalized bill value.
Step 3: Set one self-consumption and export split
Self-consumption is the share of solar generation used on-site instead of sent to the grid. It matters because a kWh used in the home offsets an imported kWh at the retail rate, while an exported kWh may earn a lower export credit. Without a battery, self-consumption depends on daytime load, occupancy, appliance scheduling, and the utility’s rate design. With a battery, it also depends on usable battery capacity, power output, and how the battery is programmed.
Use the same self-consumption percentage or the same hourly consumption profile for every quote. An installer who assumes 70% self-consumption will usually show a better payback than one who assumes 40%, even if the solar equipment is the same. The solar.org.uk guide recommends normalizing the same self-consumption assumption along with the same generation model and rates.
Step 4: Apply the same import and export rates
Use your actual rate plan, not a generic national average. If you are on a time-of-use plan, the value of solar depends on when it is produced and when it is used. If you are on a flat rate, use that rate. For exports, confirm whether the utility offers net metering, a lower export credit, or another program. Export compensation rules vary by state and utility, so the quote should state the assumed export rate and source.
A simple first-year bill-value formula is:
first-year bill value = (self-consumed kWh × import rate) + (exported kWh × export rate)
This excludes fixed charges, taxes, and any fees that solar does not reduce. It also assumes the rates are constant for the year. If a proposal includes rate escalation, use the same escalation assumption across quotes, or compare a no-escalation base case first. Energy Bill HQ recommends using the same export assumptions and incentive treatment; INTUSER Energy recommends giving both companies the same household consumption, electricity price, and export price.
Step 5: Normalize incentives and financing
Include only incentives you have confirmed you are eligible for and that apply to your tax situation. Federal tax credits, state rebates, local programs, and utility incentives can have different eligibility rules and timing. If an incentive is uncertain, show the comparison both with and without it. Do not let one quote assume a rebate that another quote excludes without noting the difference.
For financing, compare the cash price and the total financed cost, including fees, interest rate, and term. A lower monthly payment can hide a higher total price or a longer repayment period. Keep financing costs separate from the solar system’s energy value, then compare the total cost of ownership on the same basis.
Step 6: Use one time horizon and payback method
Simple payback is a screening metric:
simple payback = net installed cost ÷ first-year bill savings
It ignores time value of money, utility-rate changes, solar degradation, maintenance, inverter replacement, and the possibility that you sell the home before payback. A cash-flow comparison over the same number of years is more complete, but it still depends on assumptions. Use the same years-in-home horizon for every quote. Energy Bill HQ specifically recommends recalculating quotes with the same years-in-home horizon and financing assumptions.
Worked example: recalculating two quotes
The following numbers are hypothetical and are used only to show the arithmetic. Both quotes assume 9,000 kWh of annual generation, a household that uses 10,000 kWh per year, 50% self-consumption, an import rate of $0.20 per kWh, and an export rate of $0.08 per kWh. The first-year bill value is:
(4,500 × $0.20) + (4,500 × $0.08) = $900 + $360 = $1,260
Quote A’s installer used 60% self-consumption and a $0.25 import rate, producing a headline saving of $1,530. Quote B’s installer used 40% self-consumption and an $0.18 import rate, producing $864. After normalization, both use the same $1,260 first-year value for the same generation. The remaining difference is the installed cost, equipment, scope, and warranty.
| Item | Quote A | Quote B | Normalized comparison |
|---|---|---|---|
| Annual generation | 9,000 kWh | 9,000 kWh | Same production used for both |
| Household consumption | 10,000 kWh | 10,000 kWh | Same baseline |
| Self-consumption assumption | 60% | 40% | 50% for both |
| Import / export rate | $0.25 / $0.05 per kWh | $0.18 / $0.04 per kWh | $0.20 / $0.08 per kWh |
| Installer’s first-year bill savings | $1,530 | $864 | $1,260 for both |
| Assumed net installed cost | $20,000 | $18,000 | Compare after confirming scope and incentives |
| Simple payback at normalized savings | 15.9 years | 14.3 years | $20,000 ÷ $1,260; $18,000 ÷ $1,260 |
The table shows why the installer’s headline payback should not be the final comparison. If Quote A’s net cost is $20,000 and Quote B’s is $18,000, the normalized simple payback is 15.9 years for A and 14.3 years for B using the $1,260 first-year value. These figures exclude future rate changes, degradation, maintenance, and financing. They are a screening exercise, not a promise of savings.
What to compare after normalization
Once the financial assumptions are aligned, compare the remaining differences. ENACT’s guide recommends looking at brand-name hardware, total cost, financing offers, and warranties alongside the assumptions. INTUSER Energy recommends making the scope visible: panel capacity, inverter model, installation work, roof access and staging, electrical connection, monitoring, and aftercare. Mark anything excluded.
Useful remaining comparison points include:
- Net installed cost after confirmed incentives, both cash and financed.
- Price per installed kW as a rough equipment-and-scope metric, not a savings metric.
- Module and inverter models, warranties, and production guarantee.
- Roof penetrations, flashing, permitting, interconnection, and inspection responsibilities.
- Monitoring, service, and what happens if the company goes out of business.
- Battery details, if included: usable kWh, power output in kW, warranty, and backup capability.
If one quote includes a battery and another does not, ask for separate solar-only and battery prices. A battery can provide backup power and may increase self-consumption, but its value depends on rate design, outages, and how it is controlled. Do not treat backup capability as a bill saving.
Common mistakes
- Comparing installer payback figures directly. Recalculate both with the same inputs; otherwise you may choose the more optimistic model rather than the better system.
- Confusing kW and kWh. kW is capacity; kWh is energy produced or used over time. A quote’s kW rating does not tell you its annual kWh output.
- Counting all solar production as bill savings. Only self-consumed and exported kWh have bill value, and exports may be credited at a lower rate.
- Assuming an incentive or export rule. Confirm eligibility and the utility’s current tariff before including it in the comparison.
- Comparing a financed monthly payment with a cash price. Compare total financed cost and cash price on the same basis.
Limitations and next step
Normalizing assumptions makes quotes more comparable, but it does not guarantee a particular savings result. Actual production depends on weather, shading, equipment performance, and degradation. Actual bill value depends on your utility’s rates, export compensation, fixed charges, and when you use electricity. Installation quality and roof conditions can also change the real cost.
Your next step is to collect 12 months of kWh usage, your current rate plan, and any confirmed incentive information. Ask each installer to rerun the proposal with the same consumption baseline, production-modeling method, self-consumption assumption, import and export rates, incentive treatment, financing basis, and time horizon. Then compare the normalized first-year bill value, net cost, scope, warranty, and equipment. If a quote cannot be normalized, treat that as a missing piece of information rather than a reason to rely on the headline payback.
FAQ
Should I compare total solar price or price per watt?
Compare both. Price per installed watt can help you compare equipment and scope, but it does not by itself show bill savings. Total net cost after confirmed incentives and financing terms is also necessary, and normalized savings should be compared separately.
How should I compare quotes when one includes a battery?
Ask for separate solar-only and battery prices. Compare the battery by usable kWh, power output in kW, warranty, and backup capability, and do not count backup power as a bill saving. Then compare the solar portion on the same assumptions as the other quotes.
What if the installers use different utility rate increase assumptions?
Rerun the quotes with the same rate-escalation assumption, or compare a no-escalation base case first. A higher assumed rate increase can make a system look better without changing its installed cost or equipment.
Can I choose a solar quote based on payback alone?
Payback is useful as a screening metric, but it does not capture financing cost, maintenance, inverter replacement, home-sale timing, equipment quality, warranties, or installation scope. Use it alongside a normalized cash-flow comparison and the nonfinancial differences.
Follow the evidence
Sources & references
- ENACT, 'How to Compare Solar Quotes', September 13, 2022, https://enact.solar/how-to-compare-solar-quotes/
- solar.org.uk, 'How to compare three solar quotes properly', no publication date supplied, https://solar.org.uk/buying/comparing-quotes/
- Energy Bill HQ, 'How To Compare Solar Quotes Using One Payback Model', published/reviewed April 22, 2026, https://www.energybillhq.com/articles/compare-solar-quotes-one-payback-model
- INTUSER Energy, 'How to compare two solar quotes', updated September 17, 2026, https://intuser.net/en/guides/compare-solar-quotes/
Useful terms in this guide
- Self-consumption
- The share of solar generation used on-site instead of exported to the grid.
- Export rate
- The price or credit a utility or program pays for solar electricity sent to the grid.
- Net metering
- A utility billing arrangement that credits exported solar generation against imported electricity, with rules varying by state and utility.
- Simple payback
- Years for cumulative bill savings to equal net installed cost, ignoring time value of money and future replacements.
Have a question about these numbers?
Tell us what needs a closer look.